 eAtlas Data Catalogue
James Cook University
Type of resources
Topics
Keywords
Contact for the resource
Provided by
Years
Representation types
Update frequencies
status
-
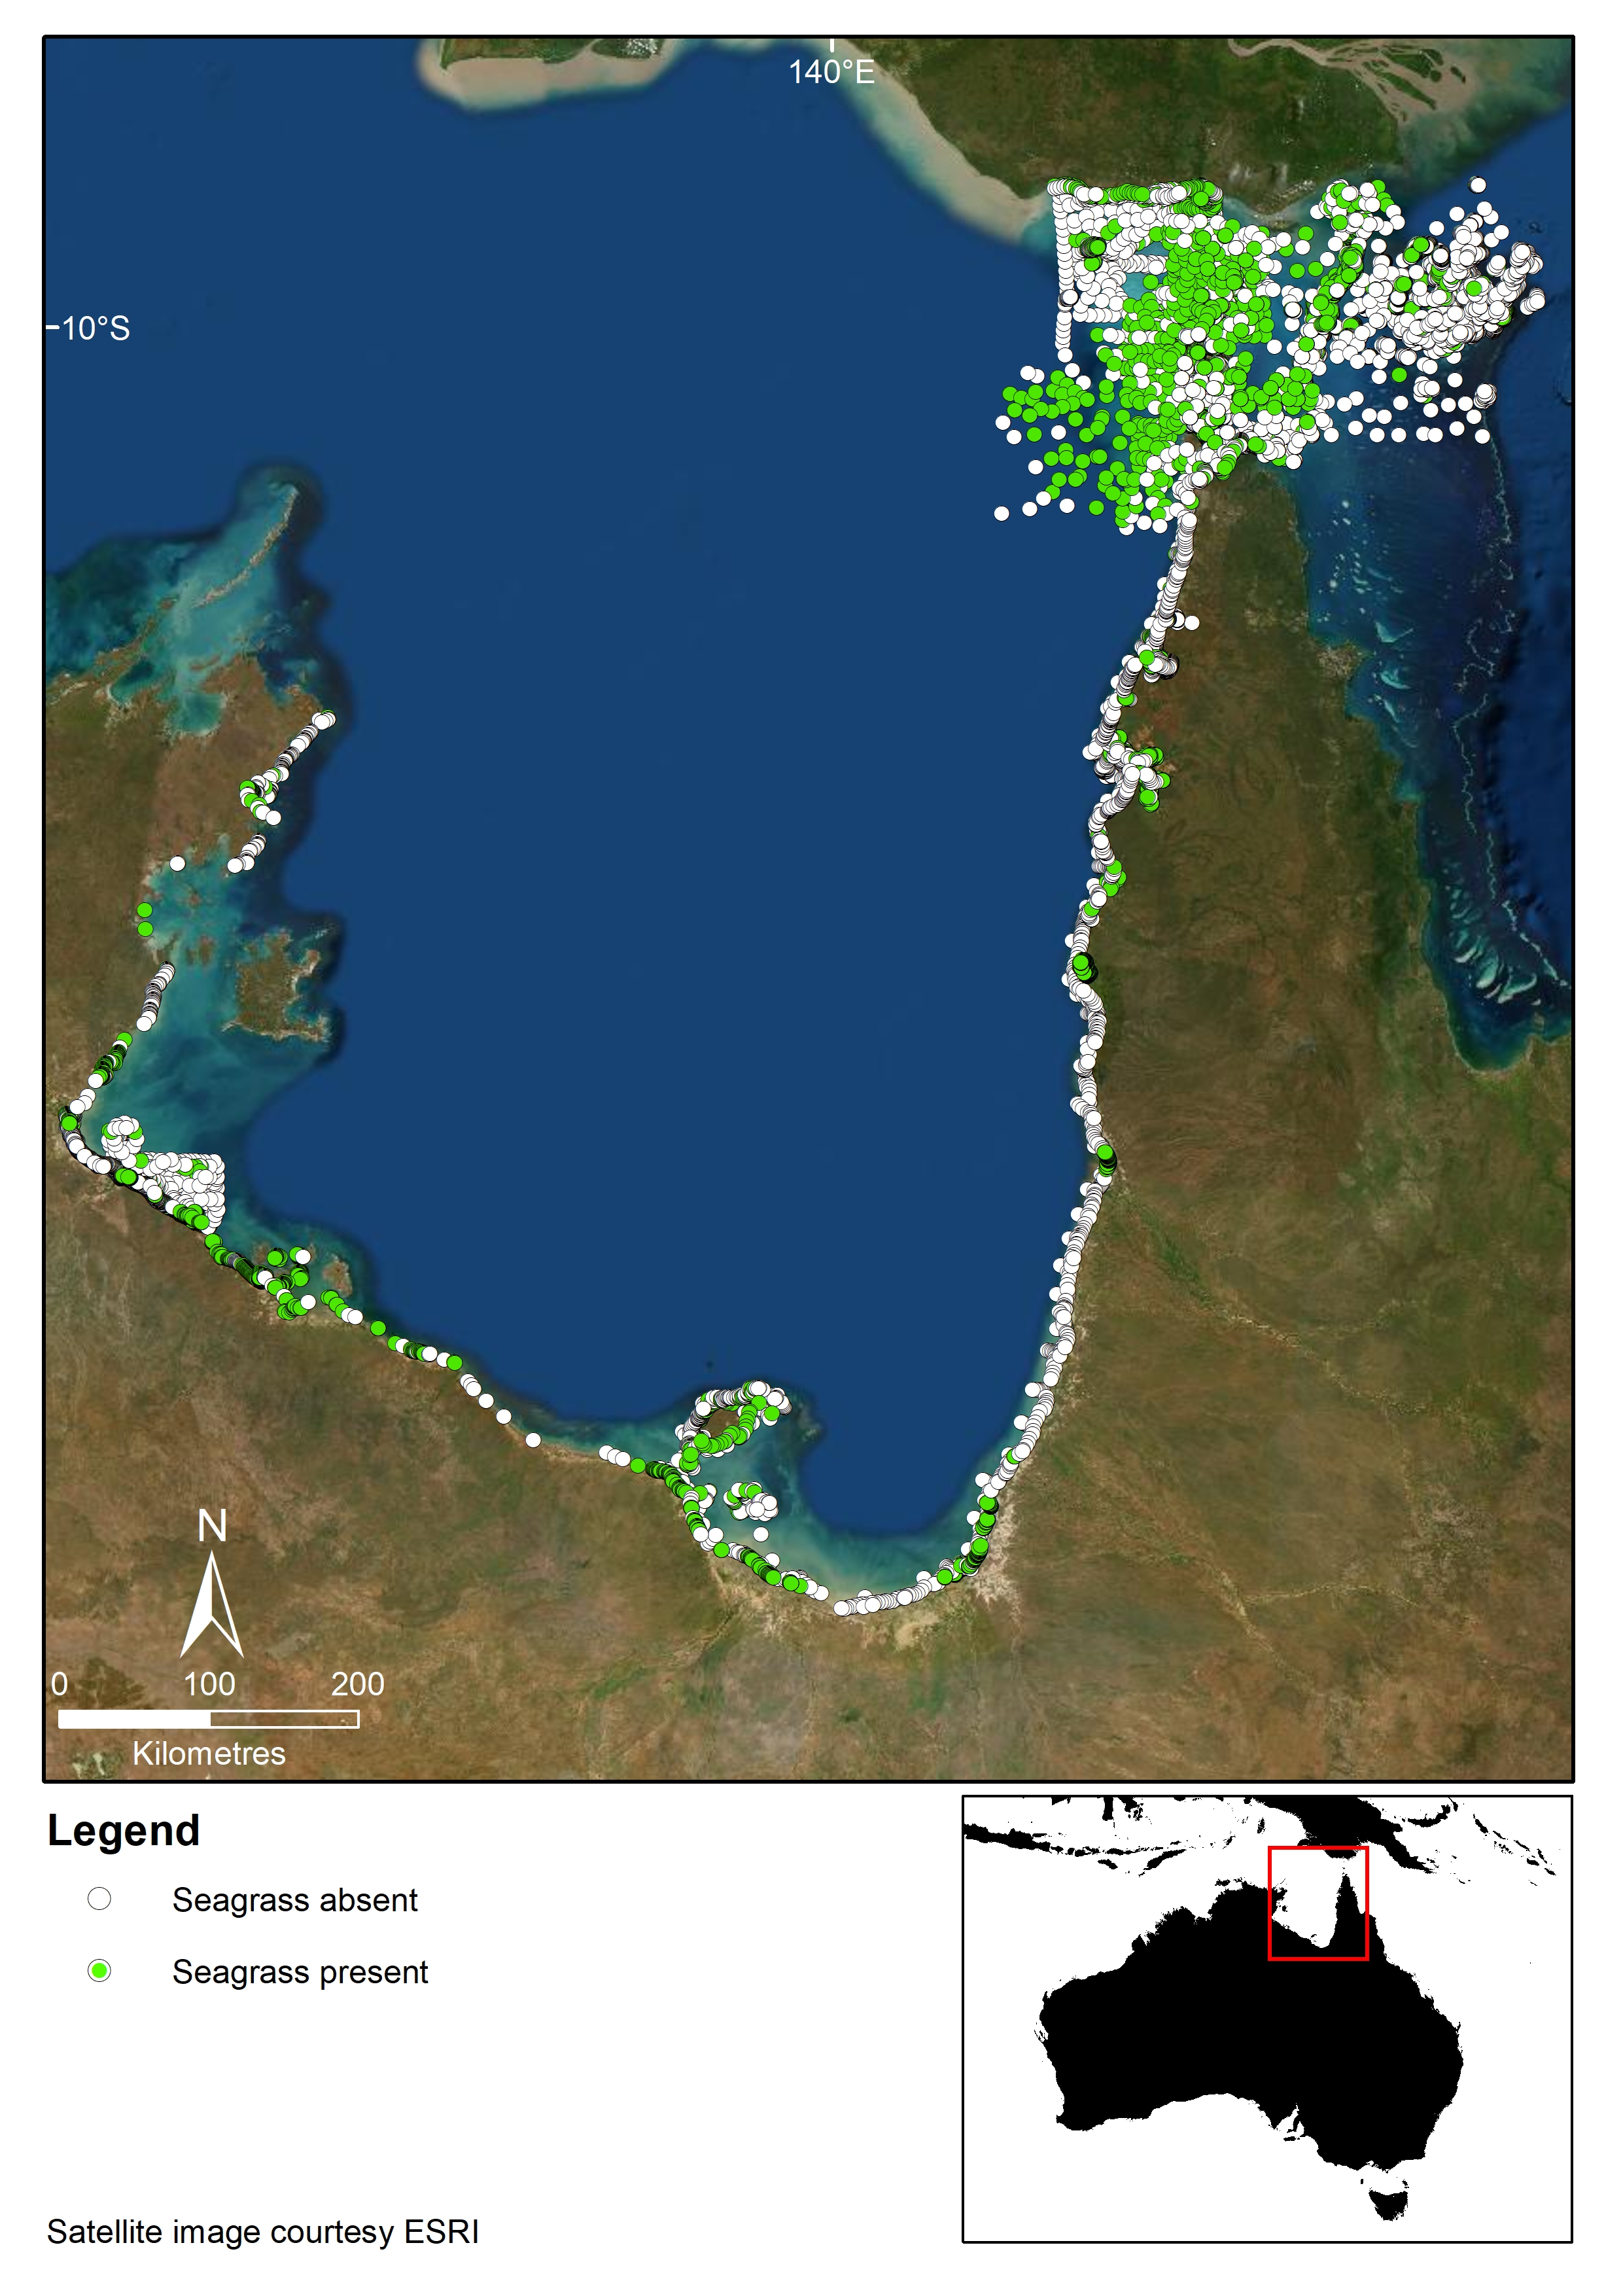
This record provides an overview of the NESP Marine and Coastal Hub small-scale study - "Synthesizing three decades of seagrass spatial data from Torres Strait and Gulf of Carpentaria". For specific data outputs from this project, please see child records associated with this metadata. The Gulf of Carpentaria and Torres Strait have globally significant seagrass habitat that provide food for threatened dugong and turtle, and habitat for commercially important fish and prawns. Key to understanding, managing, mitigating risk, and monitoring seagrass in this remote region is reliable data on seagrass distribution and species composition and how these changes through time. Data on seagrass has been collected in these areas since the 1980s, but data location and storage from these efforts remains disparate, in many cases not publicly available, and in some cases has already been lost. Our study will compile, validate and synthesize historical seagrass spatial data to create a publicly available database accessible on eAtlas. This product will provide end-users with a valuable spatial resource to assist management and monitoring of seagrass in the region. (i) Identify key seagrass habitat and migration corridors for dugong and turtles in the Gulf of Carpentaria and Torres Strait. (ii) Identify regions where seagrass information is deficient (knowledge gaps) (iii) create a foundations for models assessing exposure to risk (water quality and other environmental impacts, climate change, etc) (iv) provide essential information for management, planning, and developing long-term monitoring plans Planned Outputs • seagrass data [spatial dataset] • Final technical report with analysed data and a short summary of recommendations for policy makers of key findings [written]
-
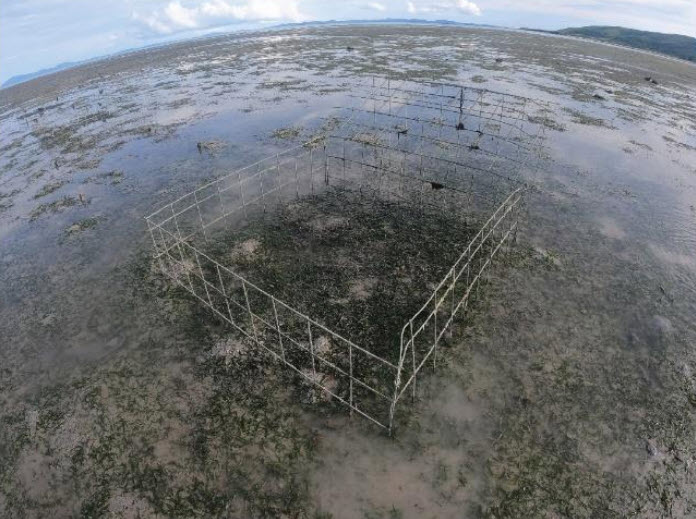
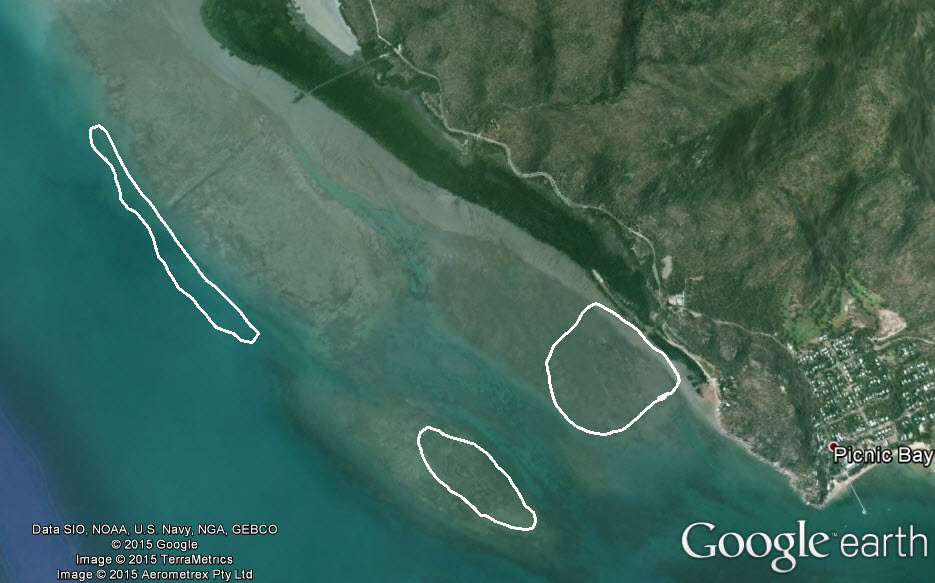
This record provides an overview of the NESP Marine and Coastal Hub small-scale study - "The role of dugong and turtle grazing in Torres Strait seagrass declines". For specific data outputs from this project, please see child records associated with this metadata. Dramatic declines in seagrass meadows in the Torres Strait Western Cluster were recorded in 2019 and 2020. These meadows are culturally important and represent significant foraging grounds for green turtles and dugongs. This project will use a short-term field study to investigate the role of megaherbivore grazing in two key locations where seagrass declines have been most dramatic. This project has been co-developed with the TSRA, Sea Rangers and Goemulgaw PBC in response to community concerns about seagrass declines and the implications for the totemic megaherbivores they support. The results will inform Traditional Owner led dugong and turtle management plans and help direct actions for remediation as required. Outputs • Field experiment assessing the whether reductions in seagrass cover at Mabuyag and Orman Reefs is due to grazing from Turtles and Dugongs. The experiment consists of cages over patches of seagrass that exclude grazers. The seagrass canopy and biomass is then compared with control patches [spreadsheet data]. • Final technical report with analysed data and a short summary of recommendations for policy makers of key findings [written]
-

This record provides an overview of the NESP Marine and Coastal Hub small-scale study - Barriers to using UAVs in conservation and environmental management. Environmental managers are embracing technology to assist with monitoring and evaluating coastal wetlands. Drones are being used routinely for fauna tracking and water sample collection; however, barriers in broader application still remain for adoption in environmental management. This research will survey conservation professionals about the barriers preventing drone adoption. Tools available for conservation and environmental research are becoming more advanced and accessible to scientists, community and managers (Isosevic et al., 2021). The ability to mobilise science and technology has become increasingly more important for governments that are faced with balancing development and protection of the environment (Cash et al., 2003, Waltham and Sheaves, 2015). With the proliferation of UAV usage in research (Shahbazi et al., 2014, Hardin et al., 2019, Tmušić et al., 2020) and innovative ways in which they can be used to collect data, it is important to investigate whether these have a place in the conservation toolbox for conservation management. Managers need data on ecosystems to manage and protect them (Dale et al., 2019, Di Stefano, 2004), therefore the potential advantages of UAVs means that data collection using these tools could be more representative and cost-effective (Joyce et al., 2019). However, current management structures do not always leverage data or innovations effectively (Cash et al., 2003). Planned Outputs • manuscript publication • summary information sheet
-
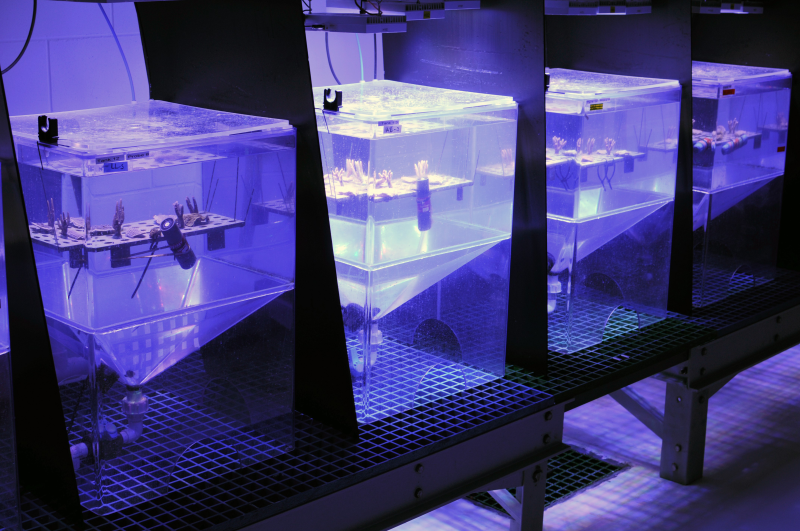
The dataset consists of four data files from a 20-day experiment to investigate different photophysiological responses of two species of coral (Acropora millepora and Pachyseris speciosa) to constant and variable daily light integrals. Methods: Eight partial colonies each of Pachyseris speciosa (from 5 – 8 m depth) and Acropora millepora (from 3 – 5 m depth) were collected from Davies Reef, central Great Barrier Reef, Australia (-18.823390, 147.6518563) in July 2016, and taken to the National Sea Simulator at the Australian Institute of Marine Science (AIMS), Townsville. Experiment consisted of four types of light exposure treatments, wherein nubbins from the partial colonies were either exposed to 20 days of high light (32 mol photons m-2 d-1), low light (6 mol photons m-2 d-1), or alternating variable light treatments. Four sets of photoacclimation and physiological responses were measured and the corresponding data has been placed in four separate csv files; (1) Fluorescence measurements were conducted using a diving pulse-amplitude modulated fluorometer (DPAM). Measurements were taken twice with the DPAM: once at 0.5 h before sunrise, to assess the maximum quantum yield of photosystem II (Fv/Fm), and at noon, after 0.5 h exposure to maximum irradiance, to assess effective quantum yield (PSII). For each nubbin, at least five measurements were taken from different regions on each nubbin and the values averaged. The excitation pressures on PSII, (see Ralph et al. 2016) was assessed to estimate the degree of photoinhibition versus light limitation. Non-photochemical quenching (NPQ), also derived from PAM pre-dawn and noontime measurements based on equations by Genty et al 1987, was measured to assess the amount of excess photon energy dissipated safely as heat. (2) At the end of the experiment, the concentration of chlorophyll a (photosynthetic) and total carotenoids (photosynthetic and photoprotective) of nubbins were compared between treatments. Tissue was removed from the skeleton with an air gun and filtered seawater, and homogenized. The slurry was centrifuged for 6-8 min at 1,500 g and the coral host supernatant was separated from the symbiont pellet. The pellet was then rinsed with filtered seawater and re-centrifuged at 10,000 g for 3 min prior to extraction. Pigments were obtained via a double extraction procedure (1 mL 95% ethanol at 4oC for 20 minutes each, with sonicator), and the absorbance was spectrophotomerically measured at 665, 664, 649 and 470 nm wavelengths. Concentrations of chlorophyll a and total carotenoids (µg/mL) were calculated based on equations by Lichtenthaler (1987) and Ritchie (2008) and standardized to nubbin surface area, which was estimated via a single wax dip protocol (Veal et al 2010). (3) At the end of the experiment, 18 nubbins were selected for respirometry measurements. Their ceramic plugs were carefully cleaned to remove algal growth. Nubbins were individually placed in 634 mL sealed stirred chambers that contained oxygen sensor spots (optodes), and the Firesting hardware/software (Pyroscience, Germany) was used to measure oxygen concentrations within the chambers every minute. Incubations ran for an hour each at ten light levels (0, 15, 40, 80, 120, 200, 300, 500, 700 and 1000 µmol photons m-2 s-1), measured with an upwards facing, calibrated, cosine corrected light sensor (meter LI-250A, sensor LI-192, Li-COR, USA). Water was flushed in the chambers at the beginning of each light level measurement. Rates of oxygen consumption (estimated respiration in the dark) and production (estimated net photosynthesis in the light) were standardized to coral surface area estimates derived from the wax dipping procedure. Photosynthesis to irradiance (P-I) curves were fitted to the data using a hyperbolic tangent fit, as described by Jassby and Platt (1976) using the ‘stats’ package (version 3.6.0) in the statistical platform R (version 3.4.0, R Development Core Team 2017). Parameters for maximum photosynthetic production (Pmax), saturation irradiance (Ik) and dark respiration (Rdark) for each treatment were estimated from fitted models. Net daily oxygen production (Pn) was calculated by predicting production using the P-I curves at actual logged experimental light levels, over a 24 h period. (4) Growth rates of A. millepora were assessed as differences in buoyant weight over time (Davies 1989). Nubbins were individually weighed to the nearest 0.001 g by suspending them on a tray below a semi-micro balance (Shimadzu AUW220D, Japan) in a water bath at ~25 OC. The percent change in buoyant weight between days 8 and 20 was assessed. Literature Cited Lichtenthaler HK. [34] Chlorophylls and carotenoids: Pigments of photosynthetic biomembranes. Methods in Enzymology. 148: Academic Press; 1987. p. 350-82. Ritchie RJ. Universal chlorophyll equations for estimating chlorophylls a, b, c, and d and total chlorophylls in natural assemblages of photosynthetic organisms using acetone, methanol, or ethanol solvents. Photosynthetica. 2008;46(1):115–26. Veal CJ, Holmes G, Nunez M, Hoegh-Guldberg O, Osborn J. A comparative study of methods for surface area and three-dimensional shape measurement of coral skeletons. Limnology and Oceanography: Methods. 2010;8(5):241-53. doi: 10.4319/lom.2010.8.241. Jassby AD, Platt T. Mathematical formulation of the relationship between photosynthesis and light for phytoplankton. Limnology and Oceanography. 1976;21(4):540-7. doi: 10.4319/lo.1976.21.4.0540. Davies S. Short-term growth measurements of corals using an accurate buoyant weighing technique. Marine Biology. 1989;101(3):389–95. doi: 10.1007/BF00428135. Ralph PJ, Hill R, Doblin MA, Davy SK (2016) Theory and application of pulse amplitude modulated chlorophyll fluorometry in coral health assessment. In: Diseases of Coral, pp. 506–523. Format: The dataset consists of four separate components, stored as .csv files, pertaining to the different physiological aspects used to understand coral responses to variable light conditions; fluorometry (85KB), pigment analysis (6KB), respirometry (9KB) and growth (1KB). Data Dictionary: pam.csv - Date: Date of sampling (DD/MM/YY) - Group: Which sampling group the individual was placed in. - Treatment: Which treatment the individual was in, where HL is High Light, LL is Low Light, VLH is Variable Light starting High and VLL is Variable Light starting Low. - Tank: Tank number each nubbin resided in - Species: Either Acropora millepora or Pachyseris speciosa - Coral_ID: Colony identification - Fo_mean: minimum fluorescence yield in dark - Fm_mean: maximum fluorescence yield in dark - DA_yield; Refers to the maximum quantum yield, quantifies the maximum potential for photosynethesis through proportion of available photosystems in a dark-adapted state (dimensionless) - F_mean; steady-state fluorescence yield in light - Fm._mean; maximum fluorescence yield in light - LA_yield: refers to the effective quantum yield, quantifying the relative number of open to closed photosystems in a light-adapted state (dimensionless) - Qm; Excitation pressure of photosystem II, which is a relationship between effective and maximum quantum yields and gives an idea of the relative light-limitation or photoinhibitory stress on the coral (dimensionless) pigments.csv - Treatment: Which treatment the individual was in, where HL is High Light, LL is Low Light, VLH is Variable Light starting High and VLL is Variable Light starting Low. - Tank: Tank number - Species: Either Acropora millepora or Pachyseris speciosa - Coral_ID: Colony identification - Individual_ID: Individual identification - Surface: Relevant for P. speciosa only, refers to whether tissue was taken from the top or the bottom of the nubbin - surfaceArea: Surface area in cm2 - ChlA: estimated total of chlorophyll a (micrograms) per individual coral nubbin - Caro: estimated total of total carotenoids (micrograms) per individual coral nubbin - chlaSA: estimate of chlorophyll a by surface area (micrograms per cm2) per individual coral nubbin - caroSA: estimate of total carotenoids by surface area (micrograms per cm2) per individual coral nubbin - Ratio: Ratio of chlorophyll a to carotenoids respirometry.csv - Date: Date of sampling (DD/MM/YY) - Group: Which sampling group the individual was placed in, based solely on order of respirometry run - Pattern: Whether the treatment was constant (HL or LL) or variable (VLH or VLL) - Treatment: Which treatment the individual was in, where HL is High Light, LL is Low Light, VLH is Variable Light starting High and VLL is Variable Light starting Low - Light: Whether light levels were low or high - Irradiance (umolEm-2s-1); Instantaneous irradiance measurement in micromoles photons per m2 per second - Species: Either Acropora millepora or Pachyseris speciosa - ID: Individual ID - Production_mgO2hr-1: Oxygen production based on respirometry in milligrams of oxygen produced per hour weight.csv (only Acropora millepora in this dataset) - Treatment: Which treatment the individual was in, where HL is High Light, LL is Low Light, VLH is Variable Light starting High and VLL is Variable Light starting Low - Tank: Tank number - Coral_ID: Colony and individual ID - Percent_change: percent change in buoyant weight Data Location: This dataset is filed in the eAtlas enduring data repository at: data\2016-18-NESP-TWQ-2\2.3.1_Benthic-light\AU_NESP-TWQ-2.3.1_AIMS_BenthicLight_experiment2
-
This record provides an overview of the NESP Marine and Coastal Hub study - Scaling-up long-term seagrass restoration in the Cocos (Keeling) Islands. For specific data outputs from this project, please see child records associated with this metadata. There is an urgent community-driven need to develop appropriate seagrass restoration approaches at scale for the Cocos (Keeling) Islands (CKI). Fast-tracking larger-scale restoration research is required to prevent imminent collapse and functional extinction of seagrasses at CKI due to past disturbance and current green turtle grazing pressure. This project builds on pilot studies to design and establish a network of larger-scale turtle exclusion areas where locally appropriate restoration approaches can be refined. At the same time, this will provide “seagrass refuges” to initiate recovery, monitor ecological effects, and provide for future restoration efforts. The project has been co-developed with the CKI community and Parks Australia, addressing their highest research priority identified in the newly established Cocos (Keeling) Islands Marine Park. The project will provide an action plan for ongoing interventions and strategies to future-proof local seagrasses and support seagrass-dependent species, such as green turtles and fish, in the long term. Planned Outputs • exclusion zones experimental data [spatial & tabular dataset] • environmental monitoring dataset [tabular data] • Final technical report with analysed data and a short summary of recommendations for policy makers of key findings [written]
-
This record provides an overview of the NESP Marine and Coastal Hub project 'Towards assessing the values of reefs in the southern Gulf of Carpentaria 2024 - 2025'. For specific data outputs from this project, please see child records associated with this metadata. The Gulf of Carpentaria Marine Park was only recently declared in 2013. The zoning plan for this marine park, which permits trawling within a specific trawling zone is due for renewal by 2028. There is a strong need to collect, analyse, synthesise and make publicly available information on the values and conditions of key habitats within the Marine Park, such as recently identified patch reefs and coral reefs, to contribute to this upcoming review of the management plan for this marine park. The limited scientific information that is available on the values of this marine park is hard to access and much of it has not been analysed or written up. In addition, the Traditional Owners hold much valuable information about the ecological and cultural values that should inform future park management decisions. This project aims to gather, synthesise and report on existing scientific data and information about coral and patch reefs in the marine park. This information will be presented to the Traditional Owners and other relevant stakeholders at community meetings or workshops. Documenting cultural values of the reefs in this marine park is beyond the scope of the current project and would require considerable further engagement with Traditional Owners. However, it is anticipated that presentation of existing scientific and biophysical data at community meetings will start this process. We will produce visual (e.g. photos and videos) outputs that illustrate the values of these reefs, in order to better inform stakeholders involved in decisions about future park management. Planned Outputs • Final technical report with analysed data and a summary of recommendations for policy makers of key findings [written]
-
This record provides an overview of the NESP Marine and Coastal Hub small-scale study - "Regional planning in northern Australia: Building a community of practice and sentinel case studies for supporting improved approaches to achieve ESD". This project grows momentum from NESP MAC Hub Project 1.32, which engaged northern Australians on the need for improved regional planning to deliver Ecologically Sustainable Development (ESD) outcomes. Project 1.32 identified Stage 2 investment to build: (i) a strong regional planning community of practice across the north; and (ii) three longer-standing sentinel case studies for improving regional planning practice within northern regions (WA, NT and Qld). In a methodological sense, the northern Australian community of practice will build on the network foundations established in Project 1.32, and will focus on scanning best practice approaches across the north, exploring innovative ways to communicate these approaches, and ensuring the network is strengthened through regular newsletters and targeted symposiums. The sentinel case study approach will inform policy and practice improvement at the jurisdictional and Commonwealth scales, and will apply Governance Systems Analysis approaches developed under previous NERP and NESP investments. This innovative method employs highly deliberative and evidence-based approaches to the practical analysis of complex governance systems in highly contested landscapes like northern Australia. Given the emerging Commonwealth focus on regional planning effort based on the Samuel review, this project represents perfect timing to focus on best practice, including knowledge management, as well as the opportunity to support emerging Commonwealth, State and Territory efforts regarding these reforms. It particularly addresses the headline issue identified in the MaC Hub 2023 Research Plan which seeks to “address the governance requirements and barriers for regional planning nationally”. This particularly includes an emphasis on northern Australia (i.e. de-risking landscapes). Planned Outputs • Case Study Governance Analysis [dataset] • Final technical report with analysed data and a short summary of recommendations for policy makers of key findings [written]
-
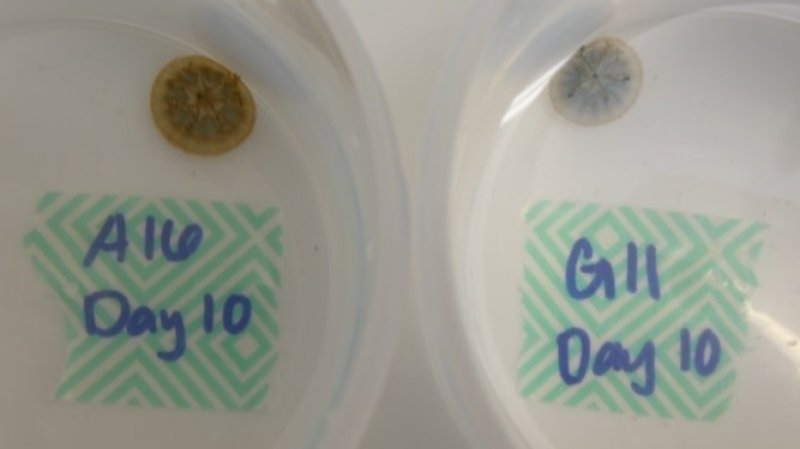
This dataset shows the effects of hexazinone (detected in the Great Barrier Reef catchments) on growth (as bell surface area), photosynthesis (effective quantum yield), zooxanthellae density (cells mm-2) and statolith number on the upside-down jellyfish Cassiopea maremetens during laboratory experiments conducted in 2017. The aims of this project were to develop and apply standard ecotoxicology protocols to determine the effects of the Photosystem II (PSII) herbicide hexazinone on the host jellyfish (growth) and endosymbiont photosynthetic efficiency (effective quantum yield and zooxanthellae density) and statolith number. A bioassay was performed over an exposure period of 14 days using hexazinone, a herbicide that has been detected in the Great Barrier Reef catchment area (O’Brien et al. 2016). The toxicity data will enable improved assessment of the risks posed by hexazinone to cnidarians and their symbionts for both regulatory purposes and for comparison with other taxa. Methods: Cassiopea maremetens were sourced from Lake Magellan, Sunshine Coast, Queensland. Jellyfish were held in 10-20 L plastic tanks partially filled with natural 0.5 µm-filtered seawater in the Marine and Aquaculture Research Facilities Unit (MARFU) at James Cook University, Townsville, Queensland. Herbicide stock solutions (100 mg L-1) were prepared using PESTANAL (Sigma-Aldrich) analytical grade hexazinone (CAS 51235-04-2). Hexazinone was dissolved in the carrier solvent acetone (final concentration 0.01% v/v), and the stock solution was prepared in Milli-Q® water. A control (no herbicide) and solvent control treatments were added to support the validity of the test protocols and to monitor continued performance of the assay. Herbicide analysis was performed by The University of Queensland, Queensland Alliance for Environmental Health Sciences (QAEHS), Woolloongabba, 4102, Australia. Individual C. maremetens medusae of similar size were placed in 250 mL plastic tanks and subjected to designated control/exposure treatments for 14 days. The treatments included two control treatments and five herbicide exposure treatments. Individuals were maintained at 25 ± 1 °C media temperature on a 12:12 h light:dark cycle under light intensity of 146 ± 15 µmol m-2 s-1. Medusae were fed 24-hr old Artemia nauplii every other day with complete solution replacement 2-5 hrs after feeding. Bell surface area (mm2) was determined using photographs taken every five days and analysed using the software ImageJ (Reuden et al.2017). Zooxanthellae density was performed following an adapted protocol of tissue digestion used in Zamoum and Furla (2012) to extract the zooxanthellae. Immediately following zooxanthellae extraction, zooxanthellae counts were conducted per individual using a Neubauer Improved haemocytometer. Zooxanthellae density (cells mm-2) was standardized to the bell surface area (mm2) of digested tissue volume. Effects of hexazinone on the photosynthetic efficiency of C. maremetens was measured by chlorophyll fluorescence as the effective quantum yield (Delta F/Fm') using pulse amplitude modulation fluorometry (mini-PAM, Walz, Germany). Light adapted minimum fluorescence (F) and maximum fluorescence (Fm') were determined and effective quantum yield was calculated for each treatment as per equation (1)(Schreiber et al. 2002). Delta F/Fm' = Fm' – F/Fm' Statoliths were extracted and counted following the Hopf and Kingsford (2013) protocol. Mean percent inhibition in bell surface area, Delta F/Fm' and statolith count of each treatment relative to the control treatment was calculated as per equation (2)(OECD 2011), where Xcontrol is the average bell surface area, Delta F/Fm' or statolith count of control and Xtreatment is the average bell surface area, Delta F/Fm' or statolith count of single treatments. % Inhibition = [(Xcontrol - Xtreatment) / Xcontrol] x 100 Effect concentrations, EC10 and EC50, for the bell surface area, photosynthetic efficiency Delta F/Fm', and statolith count were obtained relative to the control treatment. Format: Cassiopea maremetens herbicide toxicity data_eAtlas.xlsx Data Dictionary: There are five tabs for hexazinone in the spreadsheet. The first tab corresponds to the bell surface area data; the second tab is the pulse amplitude modulation (PAM) fluorometry data; the third tab is the zooxanthellae density data; the fourth tab is the statolith data; and the fifth tab shows the measured water quality (WQ) parameters (pH, salinity, and temperature) of the test. For each Hex_ ‘XXX’ tab: Nominal (µg/L) = nominal herbicide concentrations used in the bioassays; SC denotes solvent control which is no herbicide and contains less than 0.01% v/v solvent carrier Measured (µg/L) = measured concentrations analysed by The University of Queensland Rep = Replicate: for Bell and Zoox, notation is 1-5; for PAM and Stat data, notation is A, B, C, etc. Hex – Hexazinone - = no data For the ‘Hex_Bell’ tab: (includes information for each Hex_ ‘XXX’ tab as well as…) T14_SA (mm2) = Bell Surface Area at Day 14 (mm2) For the ‘Hex_PAM’ tab: (includes information for each Hex_ ‘XXX’ tab as well as…) PAM = pulse amplitude modulation fluorometry to calculate effective quantum yield (light adapted) No = number of measurements taken per individual Cassiopea maremetens. Delta F/Fm' = effective quantum (light adapted) yield measured by a Pulse Amplitude Modulation (PAM) fluorometer For the ‘Hex_Zoox’ tab: (includes information for each Hex_ ‘XXX’ tab as well as…) T14_CellsPer_mm2 = zooxanthellae density at day 14 (cells per mm2) For the ‘Hex_Stat’ tab: (includes information for each Hex_ ‘XXX’ tab as well as…) No = number of measurements taken per individual C. maremetens. T14_StatolithsperStatocyst = number of statoliths contained within a statocyst References: Hopf, J.K., Kingsford, M.J., 2013. The utility of statoliths and bell size to elucidate age and condition of a scyphomedusa (Cassiopea sp.). Marine Biology 160, 951-960 O’Brien, D., Lewis, S., Davis, A., Gallen, C., Smith, R., Turner, R., Warne, M., Turner, S., Caswell, S. and Mueller, J.F. (2016) Spatial and temporal variability in pesticide exposure downstream of a heavily irrigated cropping area: application of different monitoring techniques. Journal of Agricultural and Food Chemistry 64(20), 3975-3989. OECD (2011) OECD guidelines for the testing of chemicals: freshwater alga and cyanobacteria, growth inhibition test, Test No. 201. https://search.oecd.org/env/test-no-201-alga-growth-inhibition-test-9789264069923-en.htm Rueden, C. T.; Schindelin, J. & Hiner, M. C. et al. (2017), "ImageJ2: ImageJ for the next generation of scientific image data", BMC Bioinformatics 18:529, PMID 29187165, doi:10.1186/s12859-017-1934-z Schreiber, U., Müller, J.F., Haugg, A. and Gademann, R. (2002) New type of dual-channel PAM chlorophyll fluorometer for highly sensitive water toxicity biotests. Photosynthesis Research 74(3), 317-330. Zamoum, T., Furla, P., 2012. Symbiodinium isolation by NaOH treatment. J Exp Biol 215, 3875-3880. Data Location: This dataset is filed in the eAtlas enduring data repository at: data\nesp3\3.1.5_Pesticide-guidelines-GBR
-
This is data associated with MTSRF Task 4.8.4s, a MTSRF supported PhD project titled /Biology and ecology of the blacktip reef shark/. As part of this project, basic water quality data were collected during shark tagging trips at the study site - Cockle Bay Reef at Magnetic Island. The meta data regarding these shark catch and tagging trips are recorded in a separate data file. Basic water quality of Cockle Bay was measured at weekly to monthly intervals with handheld instruments - a YSI water quality meter (temp, salinity, condutivity, dissolved oxygen), and secchi disk depth. Data units: * Temperature - Degrees celcuis * Salinity - ppt * Conductivity - ms * Dissolved oxygen - mg/l and % saturation * Secchi depth - cm
-
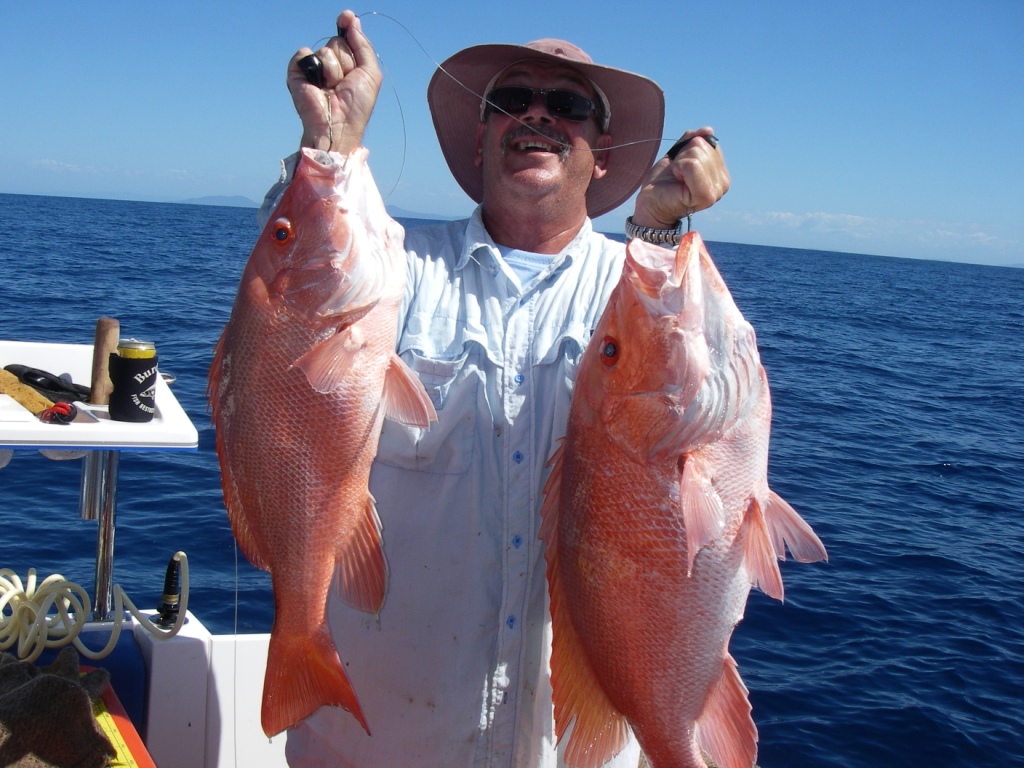
This dataset contains responses from line (n=53), charter (n=40), and trawl (n=21) fishers to a face-to-face survey about the impacts of the 2004 rezoning of the GBR on commercial fishing activity and commercial fishers. Data Units: Quantitative data about fishers attitudes, perceptions, and opinions about the 2004 zoning plan plus spatial data regarding pre- and post-rezoning locations used by fishers.